
After several years of working on the technical side of IT implementations, I found myself becoming more and more of a technology generalist. Technical Architect, Project Manager, Sr. Business Analyst, etc., were some of the career choices in front of me. However, the nature of work was mundane and lacked the angle with which I could wow my end clients. And that was something I really wanted to do!
In the course of my contract with a US big-box retailer, in early 2013, I was introduced to a reporting tool called Tableau. My role on the project was to translate the executives’ Business Intelligence needs into technical requirement documents. Our team in India was then responsible for developing reports in Tableau. Since I had a developer background, and an inner quest to find something interesting that would excite clients, I started playing around with the Tableau tool myself.
 The online help videos and knowledge artifacts online were very helpful. It was a weeklong immersive experience for me. The ease of use and powerful visualization capabilities were an instant hit with me. I could see how my clients would be excited by these as well. I fell in love with Tableau!
Its fast development and drag-and-drop capabilities empower early adopters, insulating them from coding and lengthy development cycles. Tableau offers deep and detailed articles and free video snippets on report design and development basics as a self-help option. An immersive experience of the videos is all you need to get started.
Overcoming some implementation challenges
Learning something new has always been a daunting task for most of us. We don’t not know where to start. Fear of the unknown stops us from taking the first step with anything, including Tableau. Sometimes, to make matters worse, local staff misunderstand and misrepresent Tableau in course of their free first 14 day trial. What we wanted to do is offer free guided evaluation with a potential client and evaluate their Business Intelligence Data-warehouse and ecosystem, to reduce the resistance.
In matters of the heart, time flies. Six years later, like a good wine, my commitment with Tableau has only intensified. My colleagues and clients see through me into my passion for the tool. Over the years, I found myself going away from my original path of a mundane IT generalist, to becoming a ‘data superhero’!
What is a data superhero? I have always been a fan of Simon Sinek: “Start with the Why”. For me it means following my passion of helping people find insights in their data that transform how they view their business and the actions they take. And that is why I chose this route.
A new direction
I eventually quit my 9 to 5 job and took up this mission of my life and formed a consulting firm. My clients really appreciate my work style of using an agile/quick turnaround promise. The “Joint Application Development” meetings, where we can spin out a solution, working collaboratively, in matter a matter of hours, are a game changer in my client organizations. Most of them have never experienced meetings that are this effective and productive.
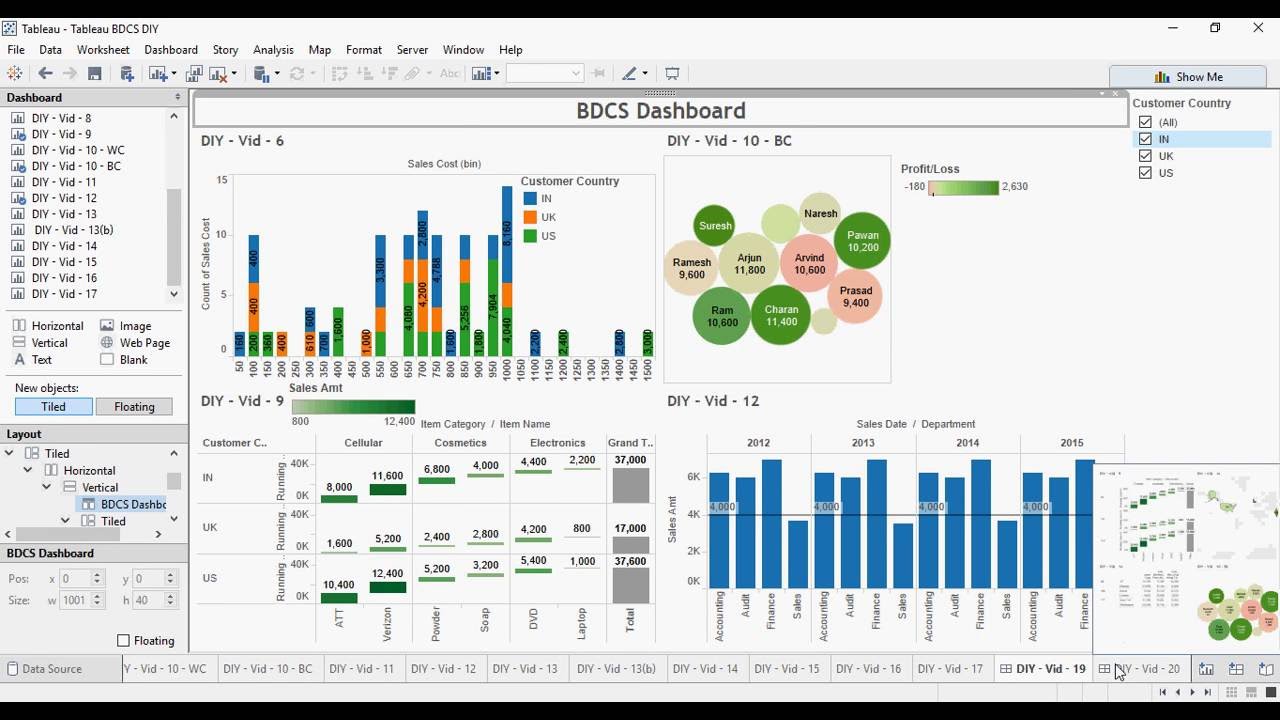
As an example, from my most recent project at RBC’s Chief Information System Officer (CISO) office, we have generated the following results in a matter of just 15 months, with just a core team of three people: a Manager, a Data-Steward and a Tableau Expert).
The Number of:
⇒ Use Cases solved = 378
⇒ Dashboards developed for our client = 95
⇒ Reports created = 43
⇒ Business Units involved across the Enterprise = 9
⇒ Person-hours saved through automation = 2,000/week!
And now I enjoy being this flag-bearer of data-insight solutions to complex business problems. Life is beautiful and I love being in this Tableau bubble having found my niche in helping my clients take data-driven informed decisions.
Current developments
Professionally, I work closely with the Toronto Tableau User Group, follow “Zen Masters” and “Tabloids” (the global group of Tableau developers, fans, users and evangelists) globally, write posts and blogs, help early adopters in their data literacy journey with Tableau. At speaking assignments, I share the story of my clients who save weeks of time and thousands of dollars in technology costs.
Since Tableau is a designed to be a self-serve, easy-to-use tool, users who know their data can design interactive, responsive reports on top of their data by themselves, without the need for expensive consultants. Users can then share insights on a server that is either hosted privately or on the Tableau Public server.
A recent highlight was speaking at the Tableau Customer Showcase Event in Toronto this past November 2018. There I shared details from the RBC CISO Tableau project mentioned above.
In my desire to give back to the community that has benefitted me so much, I recently teamed up with several individuals. These are all industry and subject matter experts in the space of Data Analytics, Business Intelligence, Big Data, Machine Learning and operational Artificial Intelligence. Ultimately, our goal is to grow a Tableau-passionate community in Toronto. That’s why we branded ourselves as ‘Data2Vizuals’: to align with our Vision and Mission to transform complex data elements into powerful, actionable visual reports.
Data2Vizuals
The plan is to meet once a month and help early adopters of Tableau in their data to visual journey. We want to share our work experience and success stories. By doing that we hope to inspire the community and help those faced with related technical challenges.
To further the cause, the Data2Vizuals team held its first meetup event on 31st of Jan 2019. The audience had professionals, students, and teams across various business verticals interested in furthering their Business Intelligence projects. In addition, we had speakers who shared their story of successfully implementing projects, and who inspired the audience in their journeys.
Peter Hadas from Hadas Partners delivered a presentation on how Organizational Change Management helps boost adoption of these new data-based technologies. Also, Thomas Moppett, Manager of Security Analytics and the Tableau Team for RBC CISO, shared his team’s successful Tableau journey. Then Kaushik Roy, an expert on Operational AI, Big-Data and Machine Learning shared his forward-looking thoughts on the future of Artificial Intelligence and the road ahead. Finally, I shared my experiences from several turn-key Tableau implementation projects at high-profile clients.
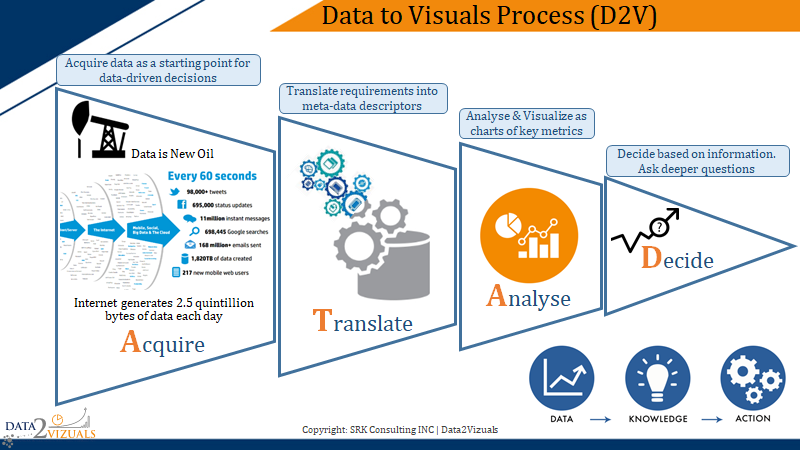
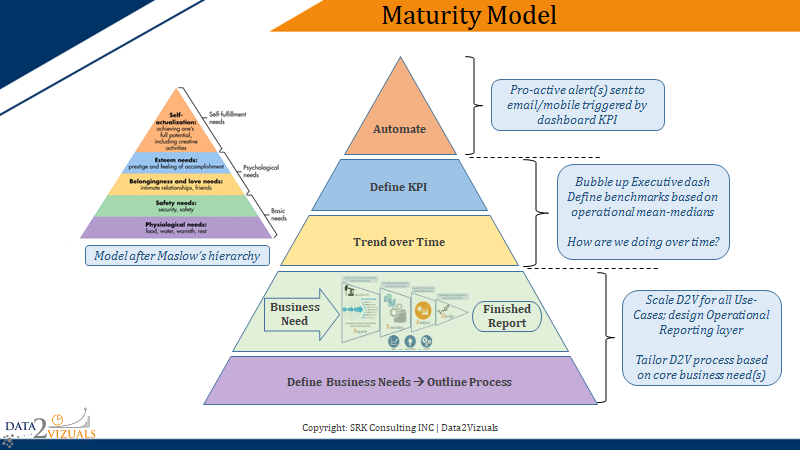
There was a lot of interest in Tableau best practices. In response we have documented and published what we consider to be gold standards, based on our years of experience. This is our ‘D2VTableau cook-book’. The slides below are a sneak-peek at the processes we designed.
Going forward
For those who want to build their skills and eventually certify themselves in Tableau, Data2Vizuals offers a master-class. We offer this master class two days a week at our downtown Toronto office. The class has a good mix of Tableau product capabilities, tool fundamentals, and best-practices lectures. In addition, we built in practical, real-world examples delivered in a hands-on workshop.
For those who are interested in knowing more, refer to our offerings under ‘Training and Coaching’ http://www.data2vizuals.com/what/. We look forward to seeing some of you there.
I also just want to thank Peter for this opportunity to guest-blog and share my story and hope it inspires you in your journey to data-driven insights.
Like this blog? Share it with your colleagues. And sign up and you won’t miss another one!